Water quality in a network is dynamic. Why continuous distribution monitoring adds useful evidence…
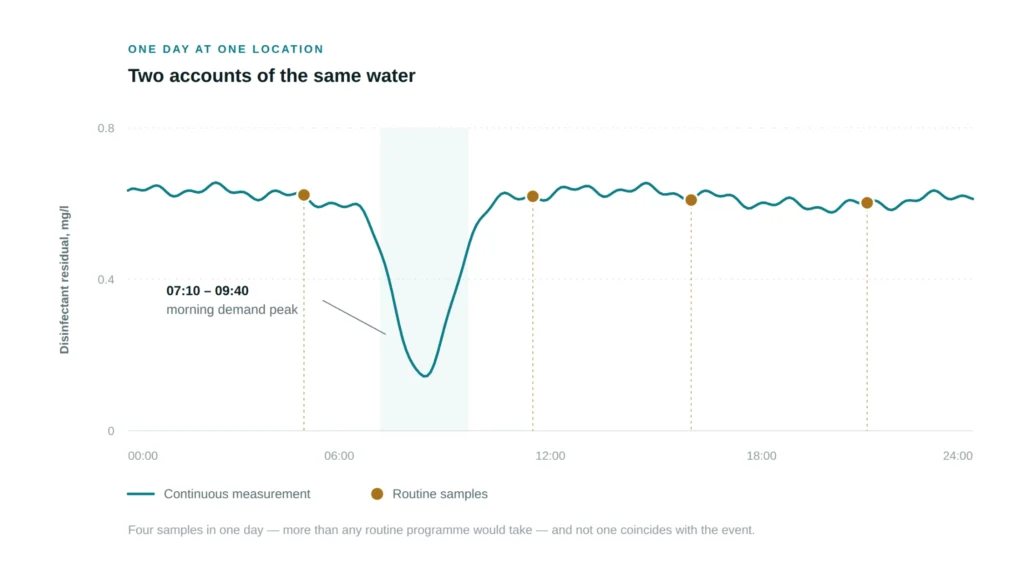
Illustrative example: The residual trace across one day with four routine samples marked on it, all landing on values within the expected range while the morning demand peak passes between them.
High compliance and real operational risk answer different questions
99.97%
Overall compliance with drinking water standards, England, 2024
472
Compliance failures associated with consumer distribution systems, 2024
586
Water quality events notified, 2025
We do not read these as being in tension. One describes whether samples met a standard, the other how a system behaved.
The journey through the network shapes water quality
Residence time, storage, blending, pressure, temperature, demand peaks and ageing assets all change water between the works and the tap. Some important changes are short-lived; others develop gradually over hours, days or seasons, so a sample can be entirely valid and still miss the behaviour that matters.


Monitoring locations require careful consideration
Density is often treated as a coverage ratio, which produces defensible-looking programmes that change very little. We suggest it is more useful to score each candidate site by the decision it could change — and to keep the low-risk control sites, which are cut first under cost pressure and are the reason anything can be demonstrated later.
What the measurements can tell you
Turbidity is demanding at low levels. Conductivity change is non-specific. A pressure event does not by itself prove a water quality consequence. These measurements do not, on their own, demonstrate microbiological safety. A continuous trace is not automatically stronger evidence than a discrete sample: its value depends on representative installation, maintained calibration and an auditable record of sensor condition.
Four kinds of evidence, which we would keep separate
Sampling verifies against a standard. Continuous monitoring shows departure from a local baseline and whether a control measure is working. Models reach where instruments cannot. A project will decide if to observe, interpret, then model or whether to use modelling to help choose monitoring sites, then observe, test and improve but it is important to keep compliance, operational, investigatory and modelled evidence separately labelled, because otherwise an organisation ends up defending an inference as though it were a result.
A change in residual or turbidity becomes more useful when compared with pressure, demand, source changes and recent work. That context helps teams decide whether to investigate a network event, review an operating practice or check the instrument. The next action should be agreed when the monitoring is designed.
Networks without a residual need more observation, not less
Where a network operates without a disinfectant residual, the monitoring strategy must reflect the controls used to maintain water quality. Changes in temperature, turbidity, conductivity and pressure can help identify departures from normal conditions and guide investigation. They need to be interpreted alongside microbiological sampling and the network’s risk assessment.
Proving it worked is harder than claiming it did
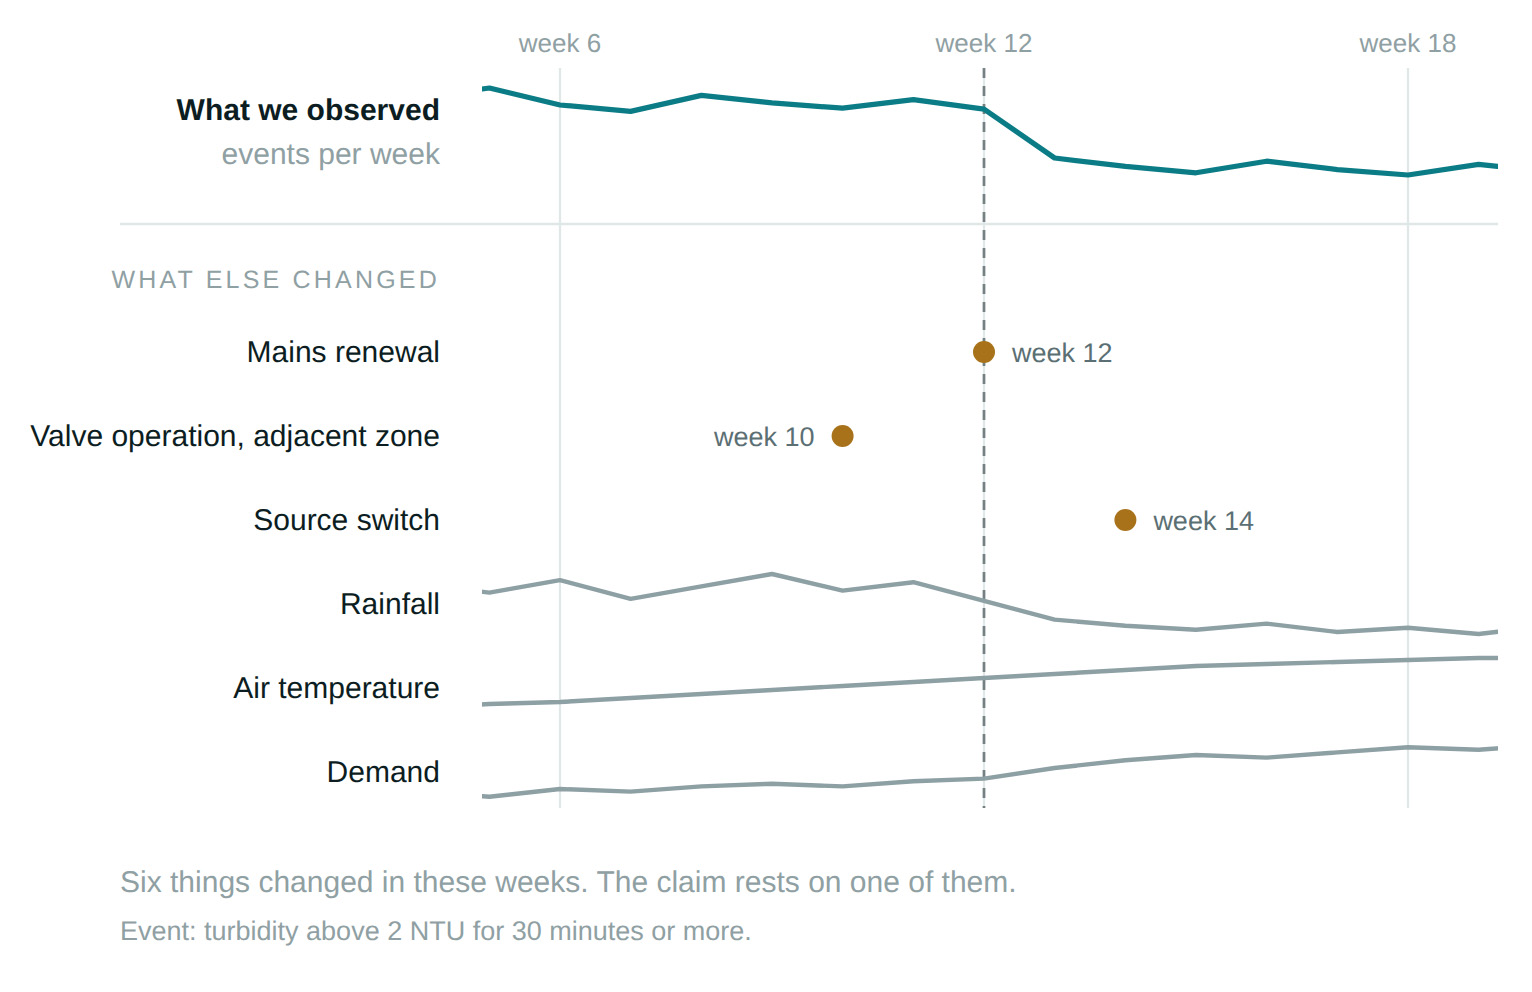
Weather, demand and unrelated work in the same zone will all move the numbers. It is crucial to define the question, baseline and comparison before work begins; relate improvements to operating conditions and other evidence. A time series supports attribution but does not automatically prove causation.
The purpose of continuous monitoring is not to create more data. It is to shorten the distance between a change in the network, an understanding of its water quality consequence, and an effective response.
This is the short version of two discussion papers, From Snapshots to System Understanding, in England & Wales and European editions. They are technology-neutral and set out where continuous monitoring does not help as clearly as where it does. We would rather hear where you think we have it wrong.